Fortinet FortiADC in Grafana

FortiADC is is a application delivery controllers (loadbalancer). The devices metrics are availalbe via SNMP. So it’s quite easy to collect those and display them in Grafana. Pre Install Make sure you have installed InfluxDB as the time-series database Telegraf as collector first. Optional you can also include the FortiADC logs when they are in elasticsearch. I use the Greylog sollution for this. Quick Start Get the latest files, at my GitHub page...

August 21, 2019 · Dennis Kruyt

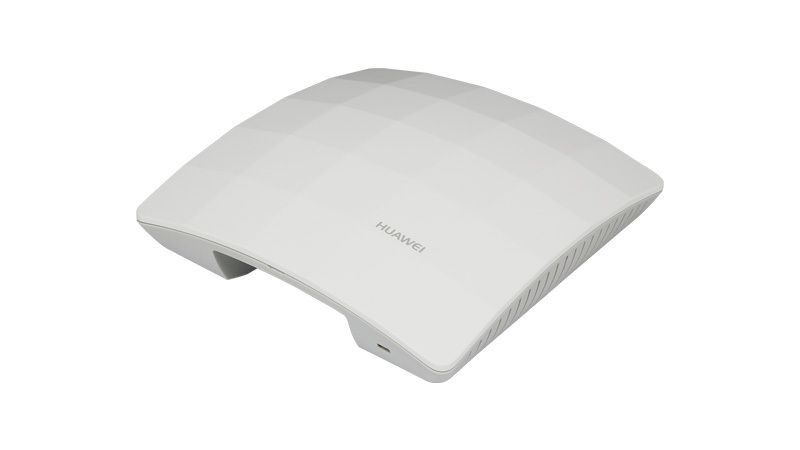
Huawei FAT WLAN Access Points in Grafana

With Huawei Enterprise Access points you have different firmware versions for different deployment scenarios. A FIT version for when you have an Wireless Access Controller (AC). This AC will managed all your AP and you have metrics available from within the AC. Huawei also offers a FAT version of the firmware for the AP. This is an standalone verion and there is no central management and overview of your AP’s with the FAT version....

January 11, 2018 · Dennis Kruyt

Huawei Dorado all flash metrics in Grafana

Recently I got my hands on a nice all flash storage from Huawei, the Dorado 5000. Off course I wanted to see if my Grafana dashboard I created for the Huawei Oceanstor series was also working on the Dorado, most is working, but some mibs are different and not all performance metrics that are availble on the Oceanstor are on the Dorado. So I adjusted the Telegraf and Grafana dashboard to work correclty with the Dorado....

January 11, 2018 · Dennis Kruyt

LizardFS in Grafana

This plugin/script for Telegraf will collect the metrics from LizardFS and stores it into InfluxDB, then you can view your metrics in Grafana on a templated dashboard.

August 14, 2017 · Dennis Kruyt

Huawei OceanStor metrics in Grafana

I manage a couple of storages at work. I got a few Huawei OceanStor storages. v2 as wel v3 storages. There is some commercial tooling from Huawei available to gather metrics, but that didn’t fit my needs. I found out that all or almost all metrics that I need are available via SNMP. So it was not hard to setup a Grafana dashboard with all metrics. Pre install Make sure you have installed InfluxDB as the time-series database Telegraf as the collector first....

July 22, 2017 · Dennis Kruyt

zswap metrics with Telegraf

A couple of weeks ago I discover zswap. zswap is a Linux kernel feature that provides a compressed write-back cache for swapped pages, as a form of virtual memory compression. Instead of moving memory pages to a swap device when they are to be swapped out, zswap performs their compression and then stores them into a memory pool dynamically allocated in the system RAM. Later writeback to the actual swap device is deferred or even completely avoided, resulting in a significantly reduced I/O for Linux systems that require swapping; the tradeoff is the need for additional CPU cycles to perform the compression....

July 19, 2017 · Dennis Kruyt