With Huawei Enterprise Access points you have different firmware versions for different deployment scenarios. A FIT version for when you have an Wireless Access Controller (AC). This AC will managed all your AP and you have metrics available from within the AC. Huawei also offers a FAT version of the firmware for the AP. This is an standalone verion and there is no central management and overview of your AP’s with the FAT version.
To have atleast a central overview of all your FAT AP’s metrics and performance I created a templated dashboard for these AP’s in Grafana.
Pre Install
Make sure you have installed InfluxDB as the time-series database Telegraf as the collector first.
Quick Start
For all latest files, see My GitHub page
- Enable SNMP on your Huawei WLAN FAT Accespoint
- Put hw_fatap.conf in your
/etc/telegraf/telegraf.ddirectory - Edit the community string as appropriate
- Edit the ‘agents’ list to include all of your monitored Fat WLAN Access points
- Put the files in the mibs dir
/usr/share/snmp/mibs - Import the Grafana dashboard json file
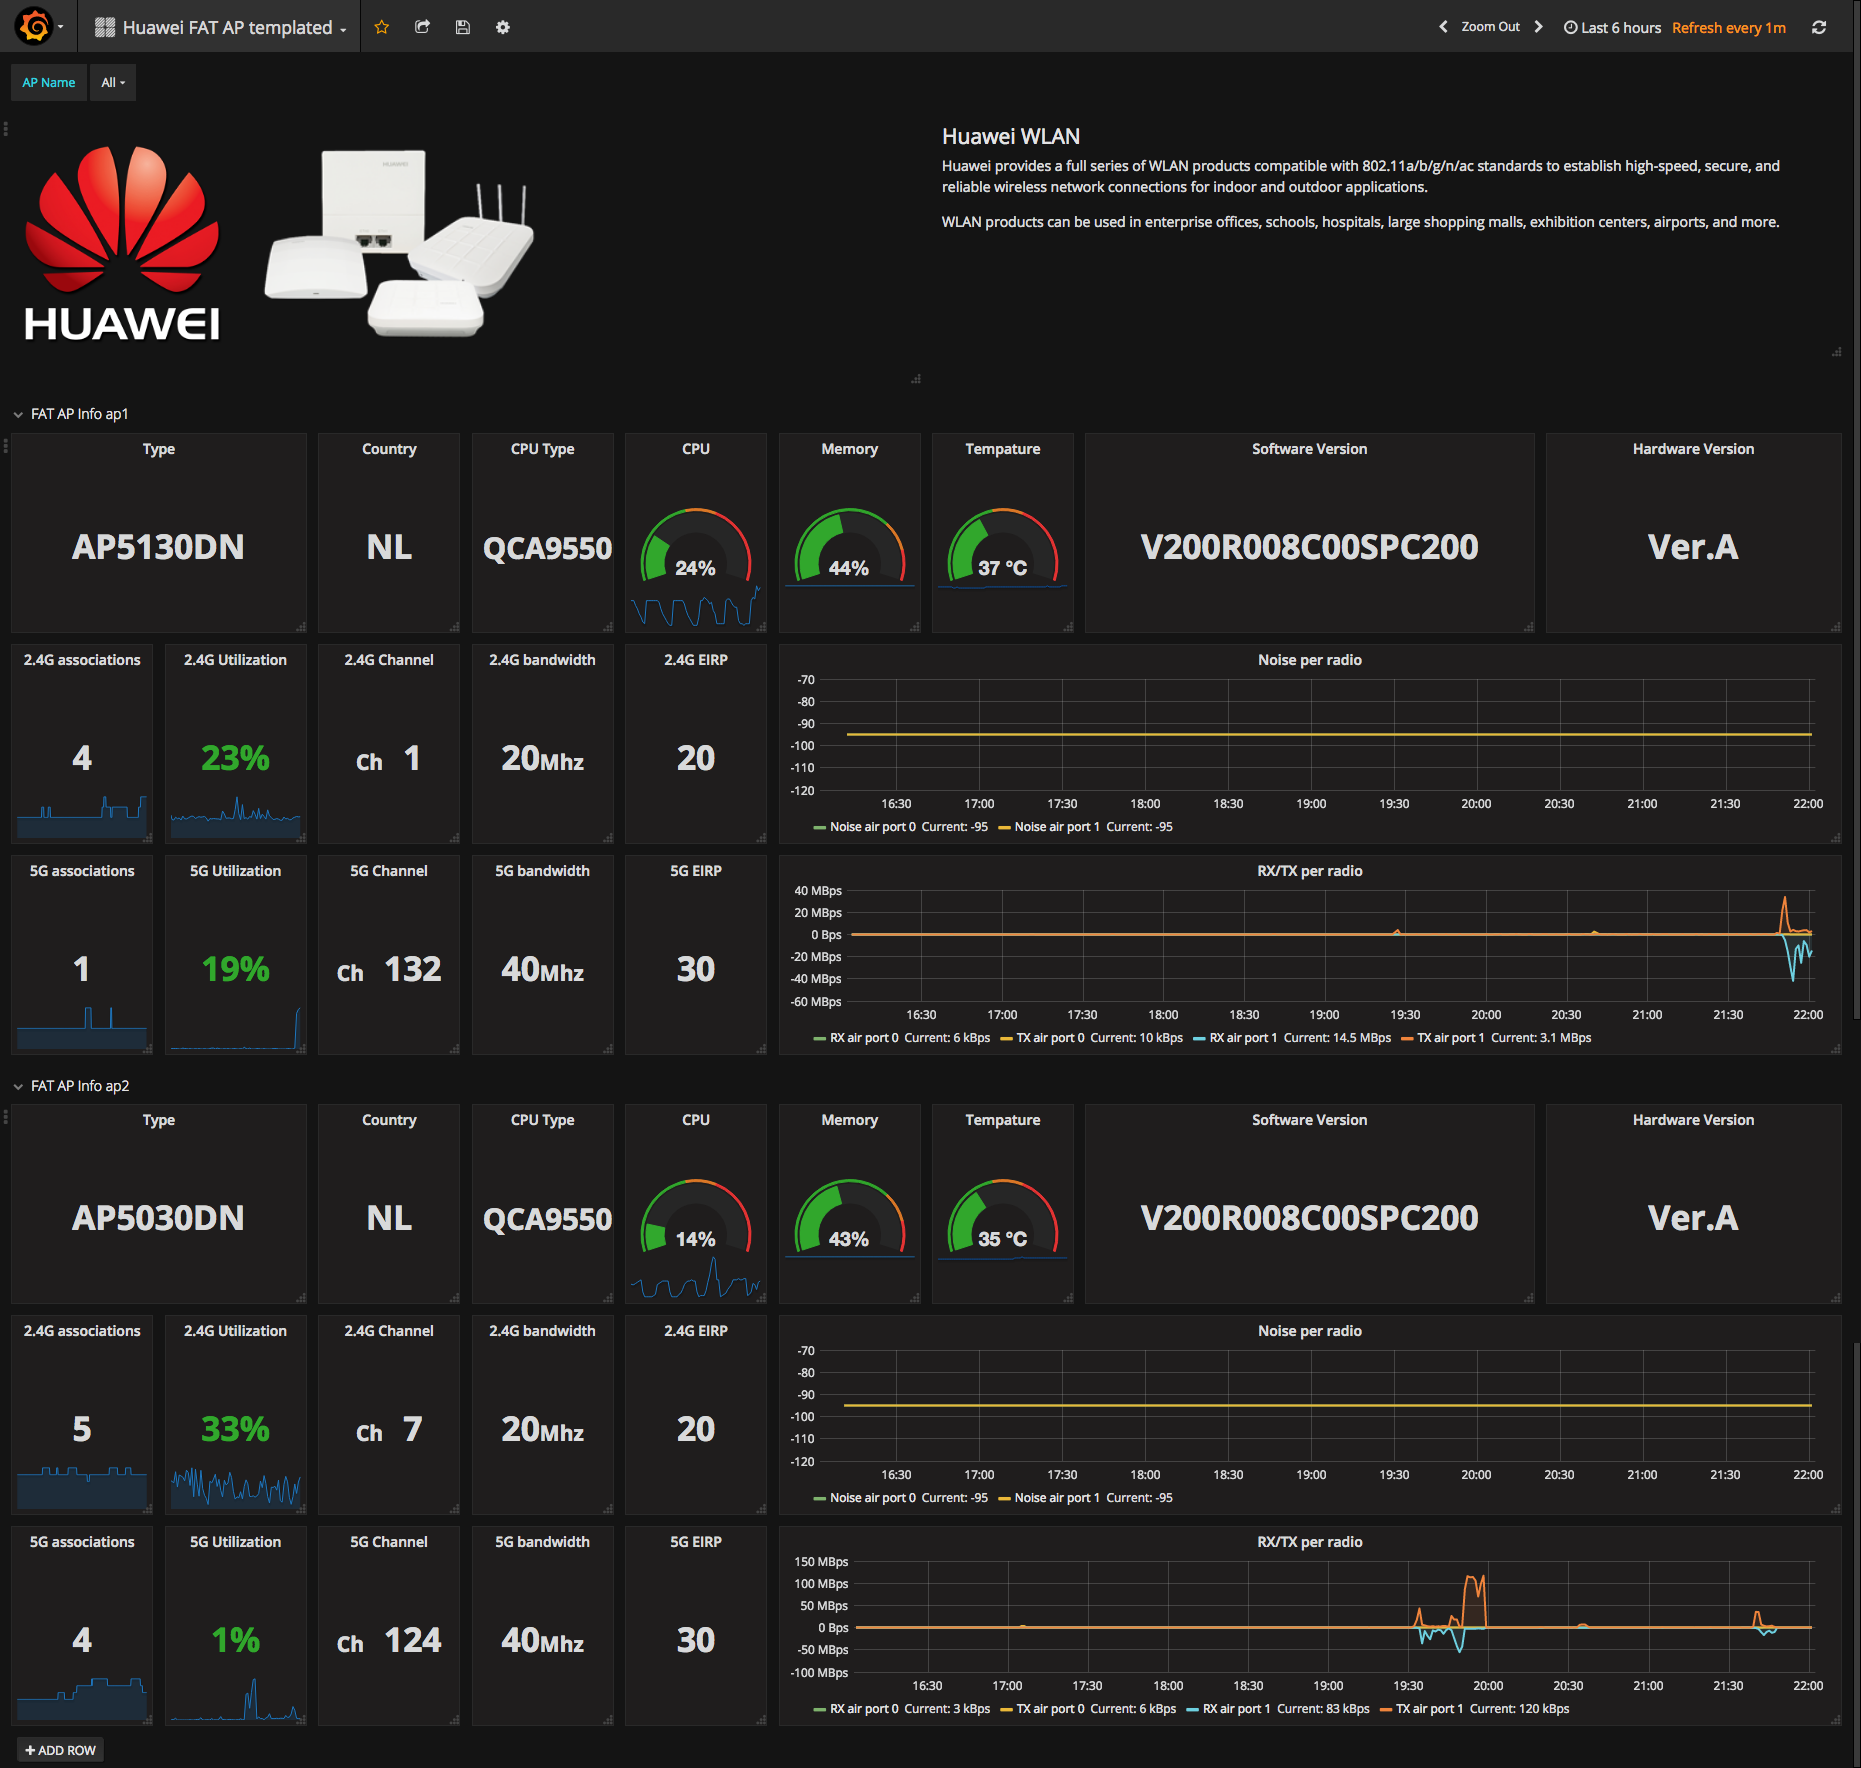
Screenshot
After you setup all, you should have a dashboard like this.