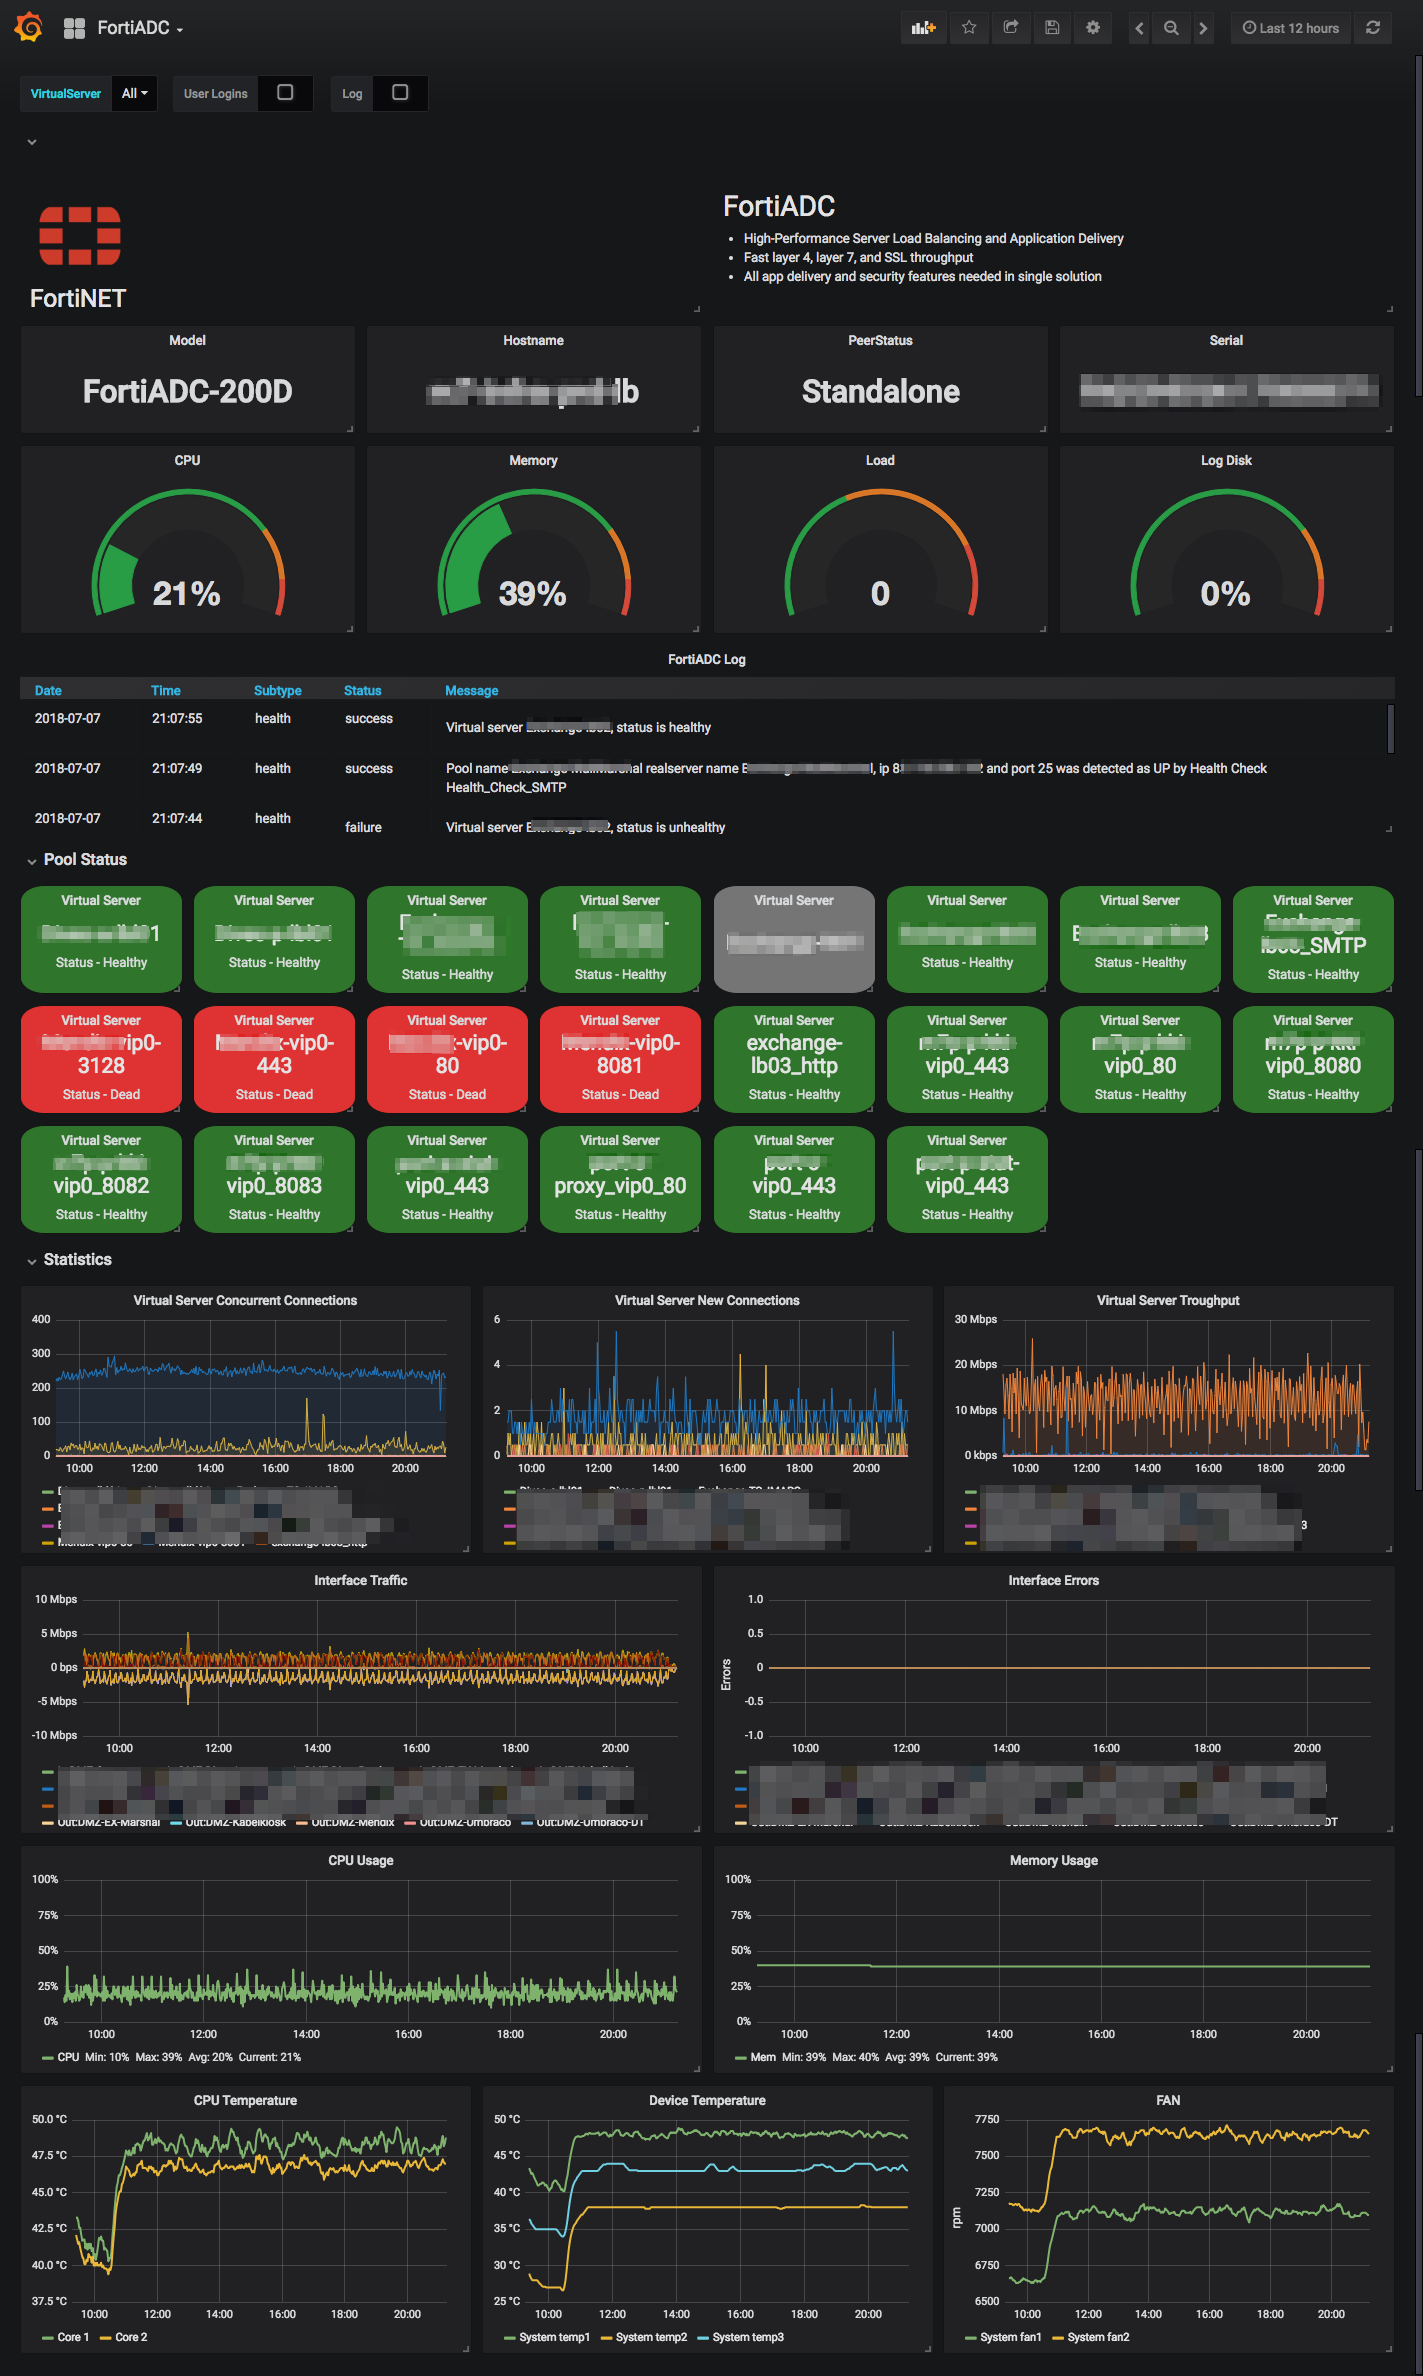
FortiADC is is a application delivery controllers (loadbalancer). The devices metrics are availalbe via SNMP. So it’s quite easy to collect those and display them in Grafana.
Pre Install
Make sure you have installed InfluxDB as the time-series database Telegraf as collector first. Optional you can also include the FortiADC logs when they are in elasticsearch. I use the Greylog sollution for this.
Quick Start
Get the latest files, at my GitHub page
- Enable SNMP on your FortiADC
- Put fortiadc.conf in your
/etc/telegraf/telegraf.ddirectory - Edit the community string as appropriate
- Edit the SNMP verion as appropriate
- Edit the ‘agents’ list to include all of your monitored FortiADC loadbalancers
- Put the files in the mibs dir
/usr/share/snmp/mibs - Import the Grafana dashboard
Screenshot
After you setup all, you should have a dashboard like this.