Recently I got my hands on a nice all flash storage from Huawei, the Dorado 5000. Off course I wanted to see if my Grafana dashboard I created for the Huawei Oceanstor series was also working on the Dorado, most is working, but some mibs are different and not all performance metrics that are availble on the Oceanstor are on the Dorado. So I adjusted the Telegraf and Grafana dashboard to work correclty with the Dorado.
Pre Install
Make sure you have installed InfluxDB as the time-series database Telegraf as the collector first.
Quick Start
Get the latest files, at my GitHub page
- Enable SNMP on your Huawei Dorado storage
- Put dorado.conf in your
/etc/telegraf/telegraf.ddirectory - Edit the community string as appropriate
- Edit the SNMP verion as appropriate, please note that verion 2 is disabled by default on the Huawei OceanStor, check with
show snmp versionon the Storage - Edit the ‘agents’ list to include all of your monitored Dorado storages
- Put the files in the mibs dir
/usr/share/snmp/mibs - Import the Grafana dashboard
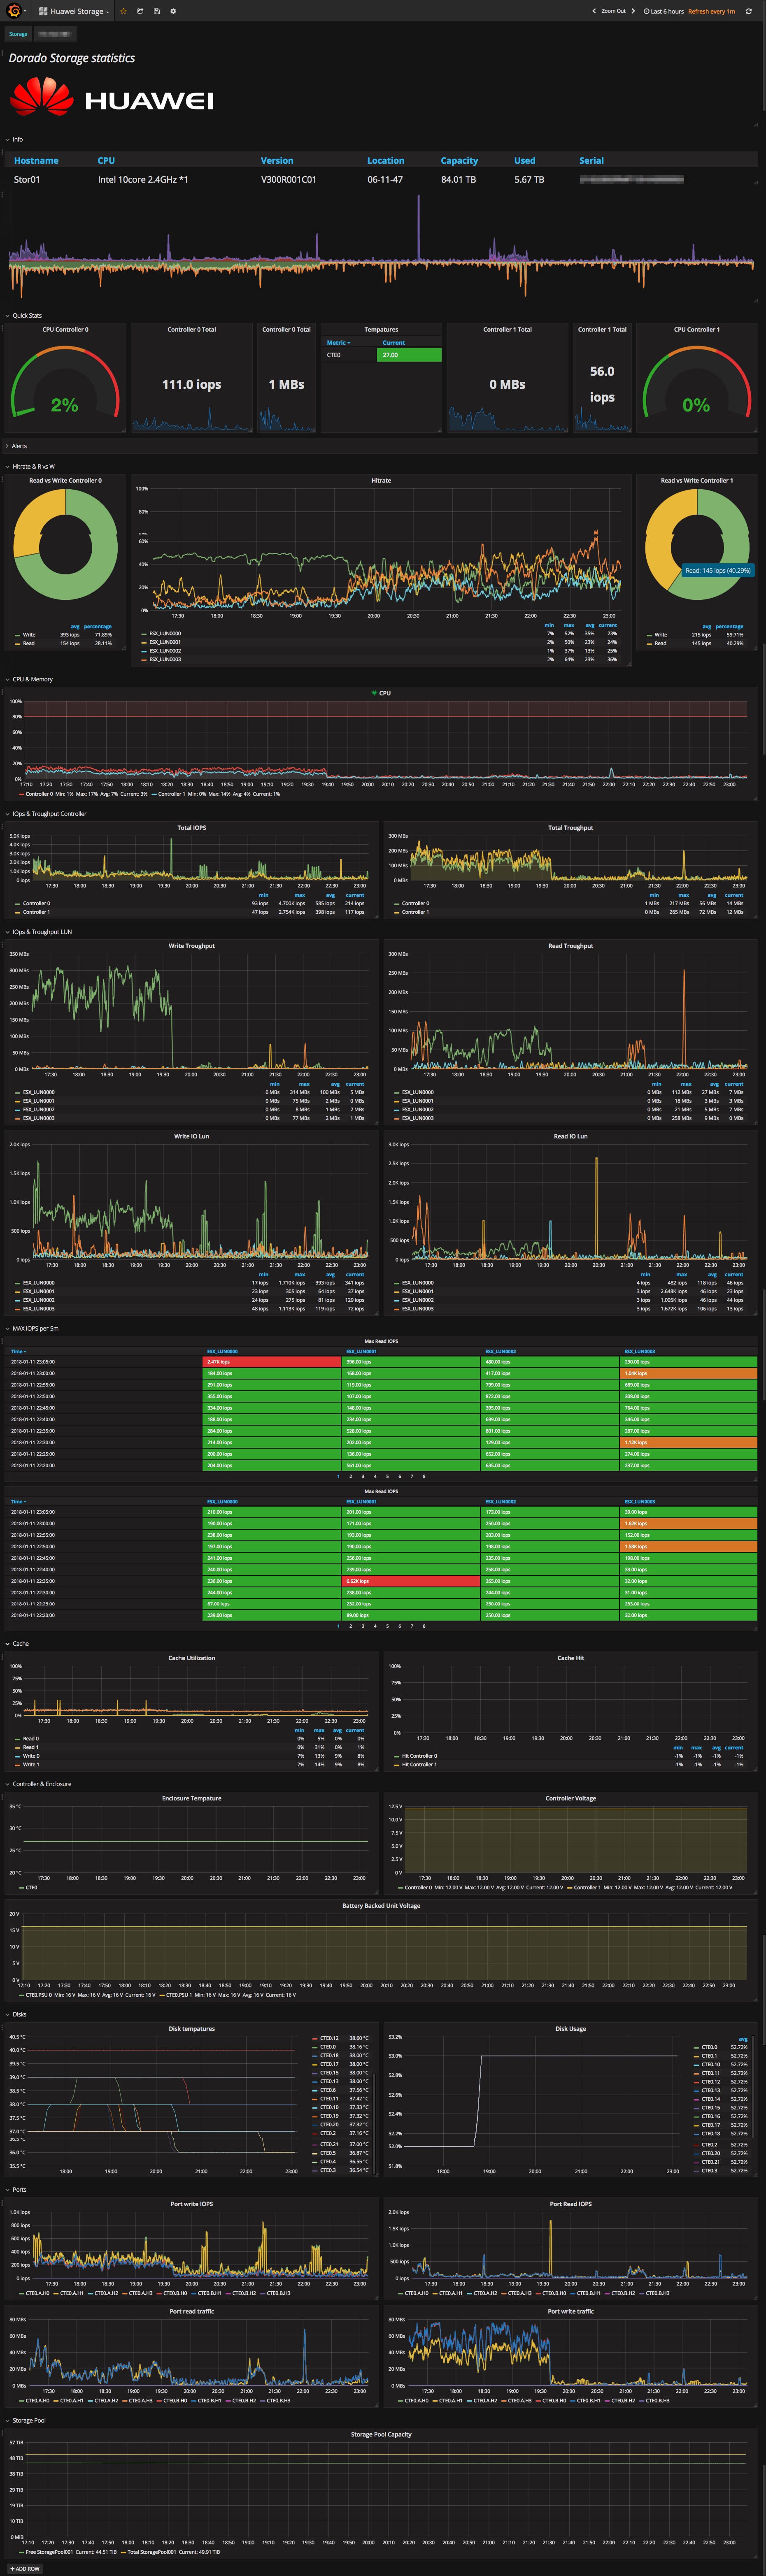
Screenshot
After you setup all, you should have some dashboard like this.