LizardFS is a Software Defined Storage, distributed, parallel, scalable, fault-tolerant, Geo-Redundant and highly available file system. I created a s plugin/script for Telegraf will collect the metrics from LizardFS and stores it into InfluxDB, then you can view your metrics in Grafana on a templated dashboard.

Pre install
Make sure you have installed InfluxDB as the time-series database Telegraf as the collector first.
Install
Get all the files, at My GitHub page.
- Put lizardfs.conf and lizardfs.sh in your
/etc/telegraf/telegraf.ddirectory. - Edit the file lizardfs.sh and change LFSADMIN variable as appropriate for your lizardfs-admin binary.
- Edit the file lizardfs.sh and change the LIZARDHOSTS to your lizardmaster, you can add multple lizardsclusters here as needed.
Test
test with:
telegraf --test --config /etc/telegraf/telegraf.d/lizardfs.conf
It should produce some thing like this:
* Plugin: inputs.exec, Collection 1
> lizard_info,lizardmaster=192.168.0.1,host=lxh-sysa-005 FS_objects=470118,Directories=36961,Files=432583,Memory_usage=198946816,Total_space=37159571947520,Available_space=22595288821760,Trash_files=0,Chunk_copies=643179,Regular_copies_deprecated=643179,Trash_space=0,Reserved_space=0,Reserved_files=0,Chunks=214393 1502747150000000000
> lizard_ready-chunkservers-count,lizardmaster=192.168.0.1,host=lxh-sysa-005 chunkservers-count=10 1502747150000000000
> lizard_chunks-health,state=AVA,goal=1,host=lxh-sysa-005,lizardmaster=192.168.0.1 safe=0,unsafe=0,lost=0 1502747150000000000
> lizard_chunks-health,goal=2,host=lxh-sysa-005,lizardmaster=192.168.0.1,state=AVA unsafe=0,lost=0,safe=0 1502747150000000000
> lizard_chunks-health,lizardmaster=192.168.0.1,state=AVA,goal=3,host=lxh-sysa-005 unsafe=0,lost=0,safe=214393 1502747150000000000

***snip***

> lizard_disks,lizardmaster=192.168.0.1,chunkserver=192.168.174.63:9533,path=/data/1/data/3.10.4/,host=lxh-sysa-005 max_fsync_time=0,used_space=705392361472,chunks=32392,read_bytes=0,max_write_time=0,read_ops=0,fsync_ops=0,to_delete="no",damaged="no",scanning="no",written_bytes=0,max_read_time=0,last_error="0",total_space=1857978597376,write_ops=0 1502747150000000000
Restart telegraf
execute:
service telegraf restart
After this it should log the statistics of LizardFS in InfluxDB. Now you can import the dashboard Grafana LizardFS Metrics.json for LizardFS in Grafana.
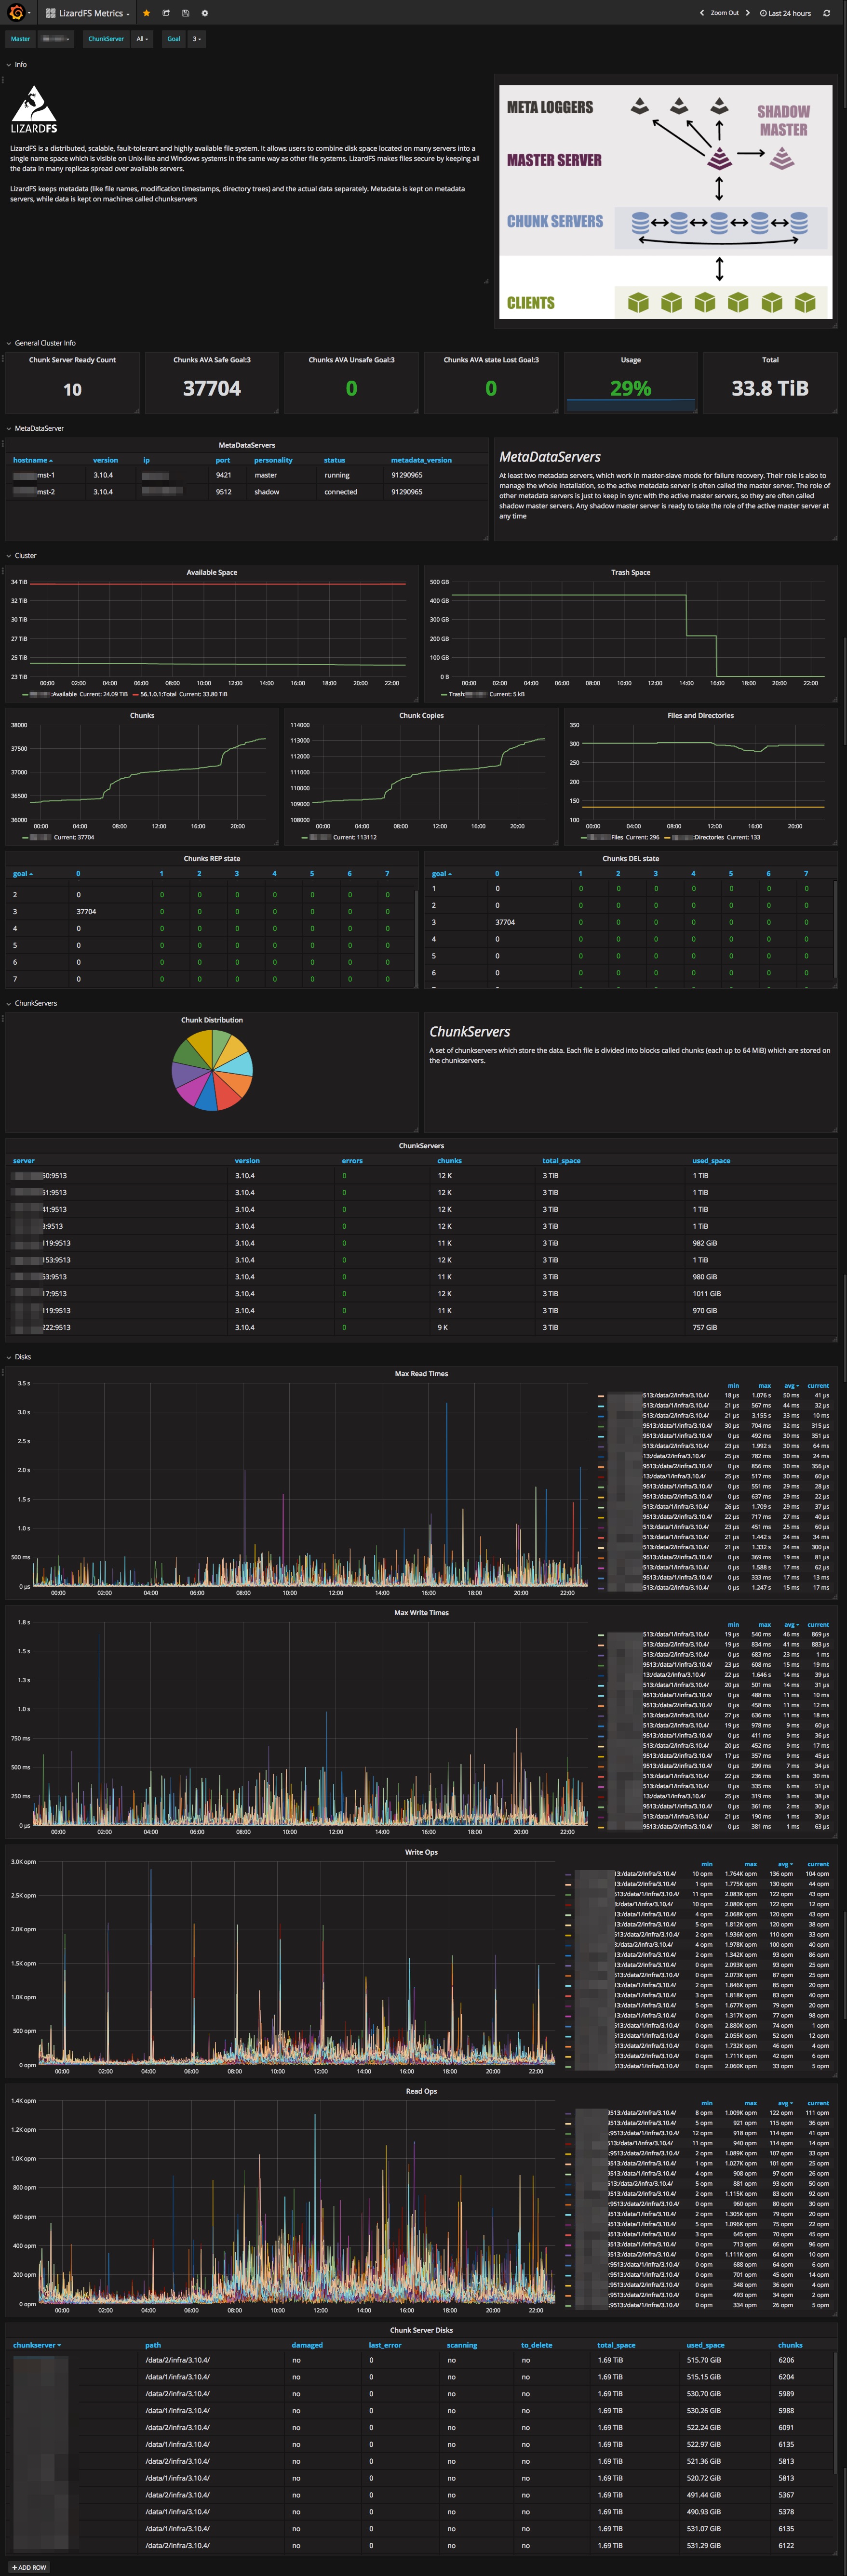
Screenshot
After you setup all, you should have some dashboard like this.