
ZeroTier on a Ubiquiti EdgeRouter
With the new EdgeOS version 2 firmware for the EdgeRouter it is now possible to install ZeroTier on this router.
With the new EdgeOS version 2 firmware for the EdgeRouter it is now possible to install ZeroTier on this router.

My Kamado’s This is where the magic happens. Smoked Pork belly Chicken Tandoor style in a Kamado Porchetta Vulcan bread Angus Uruguay Grain Fed Pichana

FortiADC is is a application delivery controllers (loadbalancer). The devices metrics are availalbe via SNMP. So it’s quite easy to collect those and display them in Grafana. Pre Install Make sure you have installed InfluxDB as the time-series database Telegraf as collector first. Optional you can also include the FortiADC logs when they are in elasticsearch. I use the Greylog sollution for this. Quick Start Get the latest files, at my GitHub page ...

I have at home a Ziggo cable internet connection. The modem that Ziggo provides is a Arris modem. I have this modem in bridge mode because I have my own router. But I like to get some DOCSIS statistics from this modem. The modem provide these via a kind of web snmp output, but this is not very useful. Ziggo Connect box To parse this output into something more readable I create a crude oneliner script. This scripts export the DOCIS statistics from the ARRIS cable modem to CSV. Replace the IP with your cable modem IP. If you are using bridge mode then probably you have the same ip as in the script below. ...

MOINK Balls? What is a MOINK? The name MOINK is a fusion of the sounds the animals (meat) from which these balls are made, Moo and Oink. Moo for the ground beef and Oink of the bacon of course. The original idea for this is from Larry of the BBQ-Brethren Forum. This is my twist on that. Ingredients • 750 gram of ground beef• 40 gram of Parmesan cheese • One Egg• A couple of garlic cloves• A tea spoon of Salt• A tea spoon of Pepper• 100 ml milk• Dried Oregano• About twenty Beacon strips• BBQ Saus• Your favourite BBQ Rub• 60 gram of breadcrumbs• Toothpicks for the balls ...

At home and at work we are running Zabbix for monitoring, for alerting I use Pushover. There are some scripts that have Zabbix and Pushover integration on share.zabbix.com, but none of them have priority support and have inline image for Pushover. On my GitHub you can find a alertscript for Zabbix and Pushover. Pushover has also a dark theme, but the Zabbix graphs are still light. So there is an option in the script to invert the graphs. So it wont hurt your eyes so much at night when you have oncall. ...

I have a Solis 5K-G Single Phase Inverter with a Ginlong LAN stick. This stick logs statistics of this inverter every 5 minutes to the Ginlong monitoring pages. Ginlong Solis Inverter I want use those statistics on the Ginlong site for my own analyses en domotica. To get those statistics to my own systems I created a python script that scrapes PV and inverter statistics from the Ginlong monitor pages every 5 min. And then outputs it to influxdb, pvoutput and/or mqtt. ...

Apple’s new macOS 10.14 codename Mojave has a nice dark theme, but to change it you need to go click trough multiple screens to change the theme. To switch fast and simple I created a Menu Bar App for this. It does exactly what you see below with a mouse click. To switch theme, click left, to exit click right on the moon/sun icon. The source code you can find on my GitHub page, the app it self DarkSome you can download it below. After downloading, unzip it and drag in to your Applications folder and execute it. ...

I am looking for a new not so expensive VPS provider. When I was looking arround for something that would suit my needs I came up with ScaleWay and Hetzner as possible candidates.
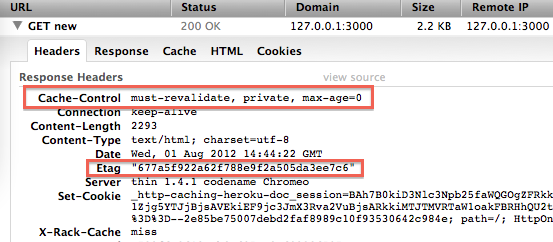
When I was looking at some Nginx caching settings to improve them on a load balanced static content farm. I noticed that the etag headers difference between servers for the same file when they should be the same. So first what is a etag header? From WikipediA The ETag or entity tag is part of HTTP, the protocol for the World Wide Web. It is one of several mechanisms that HTTP provides for web cache validation, which allows a client to make conditional requests. This allows caches to be more efficient, and saves bandwidth, as a web server does not need to send a full response if the content has not changed. ...