
I have at home a Ziggo cable internet connection. The modem that Ziggo provides is a Arris modem. I have this modem in bridge mode because I have my own router. But I like to get some DOCSIS statistics from this modem. The modem provide these via a kind of web snmp output, but this is not very useful.
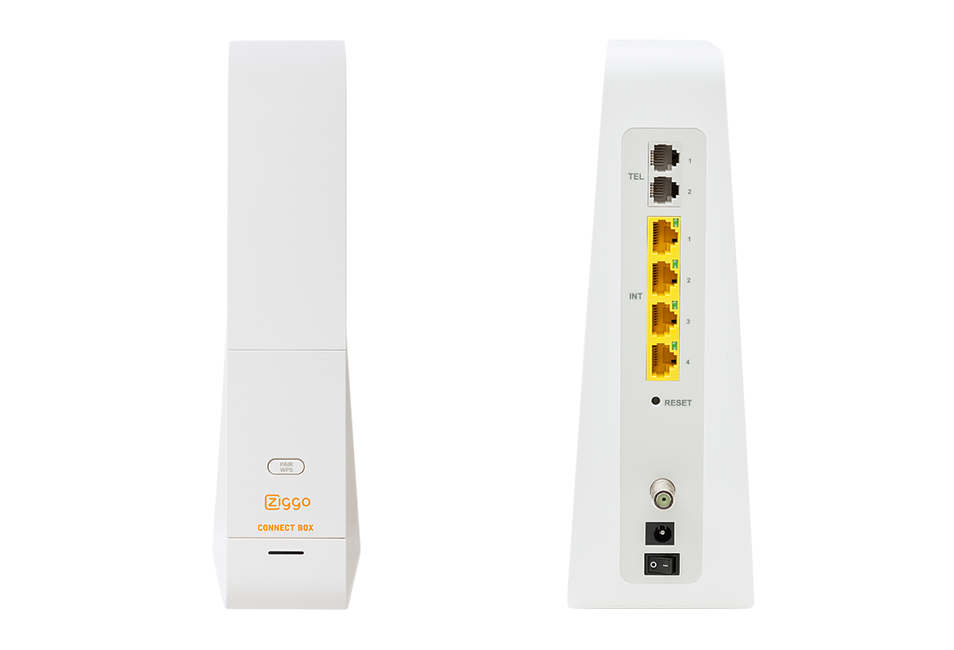
Ziggo Connect box
To parse this output into something more readable I create a crude oneliner script. This scripts export the DOCIS statistics from the ARRIS cable modem to CSV. Replace the IP with your cable modem IP. If you are using bridge mode then probably you have the same ip as in the script below.
Place the file in the directory /etc/telegraf/telegraf.d/arrisstatus.sh and make it executable (chmod +x arrisstatus.sh) __
#!/bin/bash

echo "measurement,channel,value"
curl -s 'https://192.168.100.1/getRouterStatus' --compressed --insecure | sed s/1.3.6.1.2.1.10.127.1.1.1.1.1/docsIfDownChannelId/ | sed s/1.3.6.1.2.1.10.127.1.1.1.1.2/docsIfDownChannelFrequency/ | sed s/1.3.6.1.2.1.10.127.1.1.1.1.4/docsIfDownChannelModulation/ | sed s/1.3.6.1.2.1.10.127.1.1.1.1.6/docsIfDownChannelPower/ | sed s/1.3.6.1.2.1.10.127.1.1.2.1.1/docsIfUpChannelId/ | sed s/1.3.6.1.2.1.10.127.1.1.2.1.2/docsIfUpChannelFrequency/ | sed s/1.3.6.1.2.1.10.127.1.1.2.1.3/docsIfUpChannelWidth/ | sed s/1.3.6.1.2.1.10.127.1.1.2.1.15/docsIfUpChannelType/ | sed s/1.3.6.1.4.1.4115.1.3.4.1.9.2.1.2/arrisCmDoc30IfUpChannelExtendedSymbolRate/ | sed s/1.3.6.1.4.1.4115.1.3.4.1.9.2.1.3/arrisCmDoc30IfUpChannelExtendedModulation/ | sed s/1.3.6.1.4.1.4491.2.1.20.1.2.1.1/docsIf3CmStatusUsTxPower/ | sed s/1.3.6.1.4.1.4491.2.1.20.1.2.1.2/docsIf3CmStatusUsT3Timeouts/ | sed s/1.3.6.1.4.1.4491.2.1.20.1.2.1.3/docsIf3CmStatusUsT4Timeouts/ | sed s/1.3.6.1.4.1.4491.2.1.20.1.24.1.1/docsIf3SignalQualityExtRxMER/ | sed s/1.3.6.1.2.1.10.127.1.1.4.1.3/docsIfSigQCorrecteds/ | sed s/1.3.6.1.2.1.10.127.1.1.4.1.4/docsIfSigQUncorrectables/ | sed s/1.3.6.1.2.1.10.127.1.1.4.1.5/docsIfSigQSignalNoise/ | sed s/1.3.6.1.2.1.69.1.5.8.1.2/DevEvFirstTimeOid/ | sed s/1.3.6.1.2.1.69.1.5.8.1.5/DevEvId/ | sed s/1.3.6.1.2.1.69.1.5.8.1.7/DevEvText/ | sed s/1.3.6.1.2.1.126.1.1.1.1.1/docsBpi2CmPrivacyEnable/ | sed s/1.3.6.1.4.1.4491.2.1.21.1.3.1.8/docsQosServiceFlowPrimary/ | sed 's/"//g' | sed 's/,$//g' | sed 's/\./,/' | sed 's/:/,/' | grep "^[a-z]"
Then create a cronjob for it that writes the CSV output every minute to a tmp file.
* * * root /etc/telegraf/telegraf.d/arrisstatus.sh > /tmp/arris-status.csv
I then use Telegraf to parse the CSV output and store the values in a InfluxDB database. The following config can be placed in the /etc/telegraf/telegraf.d directory. If you don’t have the TIG stack running, see here for instructions to het this up and running.
[[inputs.file]]
  files = ["/tmp/arris-status.csv"]
  data_format = "csv"
  csv_tag_columns = ["channel"]
  csv_header_row_count = 1
  csv_measurement_column = "measurement"
The following Grafana dashboard can be used to show all the graphs. Download the JSON file and import into Grafana. If you want to test the dashboard see a demo page on raintank.io.
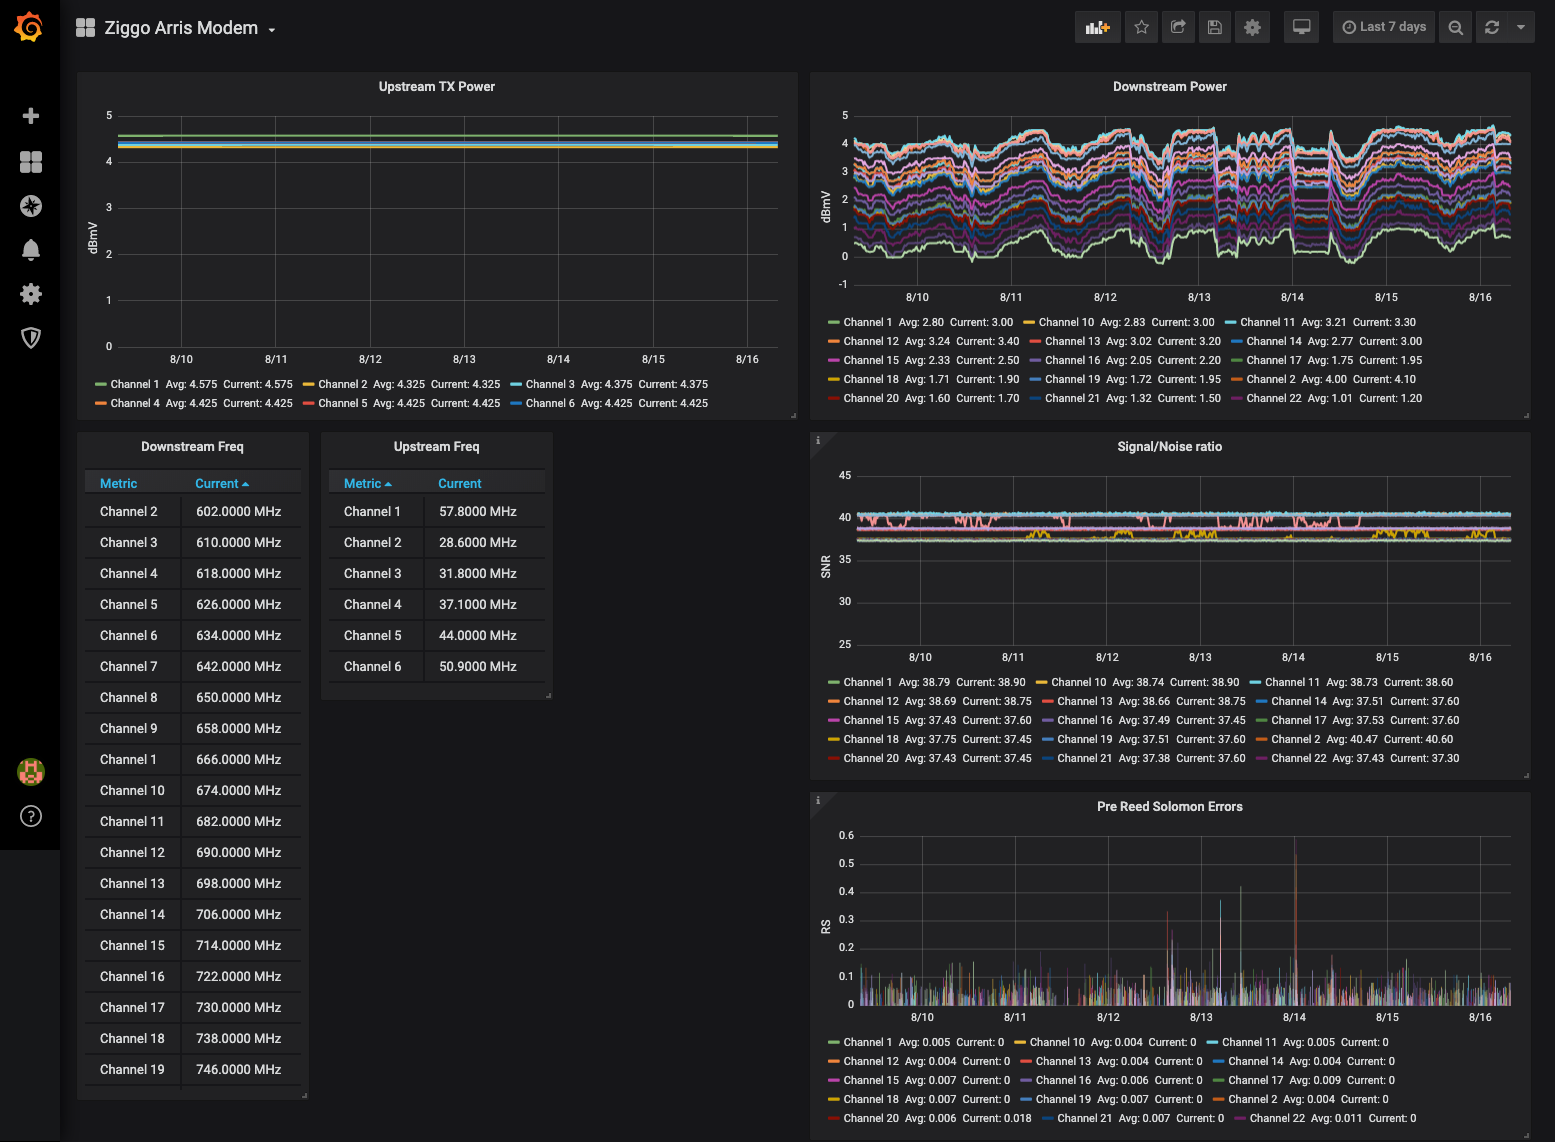
Grafana dashboard
Now you can keep an eye on the signal values 😉. Below you can see the downstream power signals changing after a scheduled Ziggo maintenance in my neighbourhood.
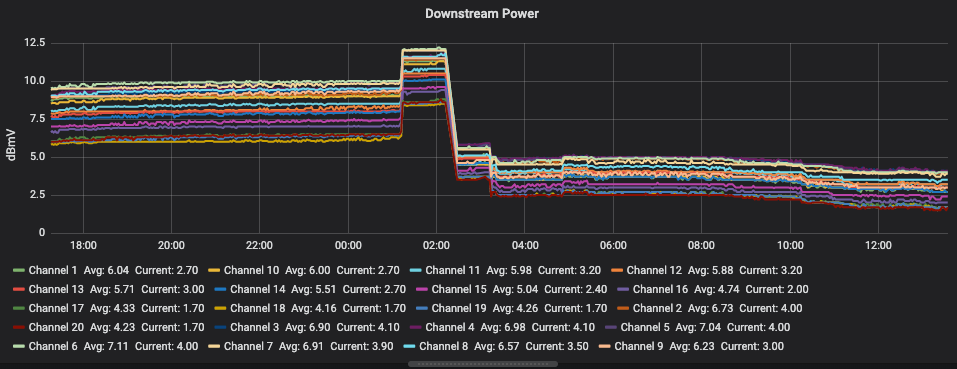
Ziggo maintenance