
Disclaimer
The options and values here are just to show what is possible these are not absolute magic values. And every workload is different. So measure, adjust, measure again, re adjust…
Read-ahead Linux
To get a better read-ahead on your disk you can set this to 4096 blocks instead of the default 256. This also depends on the type of use (read vs write) of the disk.
For example a database disk with a lots of reads you want a higher read-ahead. But this is very workload depended if you will have any result.
/sbin/blockdev --setra 4096 /dev/sdb
In order not to lose these settings after a reboot, place the following per disk in the _/etc/rc.local _ file.
# Mysql Tuning for filesystem
# Database Disk
/sbin/blockdev --setra 4096 /dev/sdb
# Logging Disk
/sbin/blockdev --setra 256 /dev/sdc
Mount options
Especially in virtual machines that have their data on shared storage, it is important to prevent as many unnecessary I/O as possible. The option atime writes on every acces the acces time. Better to use is the option relatime. For application that don’t use the acces time on a dedicated mount point we can also use noatime.
# <file system>         <mount point>  <type>  <options>              <dump>  <pass>
/dev/mapper/vg01-var    /var          	ext4    defaults,relatime	1       2
/dev/sdb    			/var/lib/mysql	ext4    defaults,noatime	1       2
Swappiness Linux
The following setting in /etc/sysctl.d/swappiness.conf __ causes the kernel to write less aggressive RAM memory to swap space on disk. A couple of years ago a value of 0 was minimal swapping and valid. But with newer kernel releases this has changed. From RHEL 6.4 or Linux kernel 3.5-rc1 the behavior of the swappiness setting has changed. So check your distro/kernel what is valid and not.
# Less aggressive swapping
vm.swappiness = 1
Redhat recommends a value of 10 when running a dedicated Oracle database. MariaDB recommends a value of 1 when running a dedicated MariaDB database.
Dirty Pages
This setting ensures that the kernel speeds up ‘dirty’ pages (changed datain RAM, which has not yet been written to disk) from memory to disk.In the past, with RAM sizing up to 1024MB, a high percentage was fine. Withthe huge amounts of RAM that some servers have this is that after a long time, large amounts of data are suddenly transferred to disk written when the limit is reached.This setting prevents peak load on storage and streamlines I/O.Change the following to /etc/sysctl.d/dirty_pages.conf:
# Write dirty pages faster to disk
vm.dirty_background_ratio = 3
vm.dirty_ratio = 40
I/O Scheduler Linux
Some older Linux distributions are not yet adjusted to the virtual world. So the standard scheduler must be adjusted in the Virtual Machines. VMware has issued the following advice for this.
The NOOP scheduler can also be used for fast storage backends (SAN / NAS). The Deadline scheduler can also be used as an alternative.
To permanently and system-wide adjust the scheduler, the boot options of the kernel must be adjusted. Add the following to the GRUB_CMDLINE_LINUX_DEFAULT and regenerate grub.
elevator=noop
It is also possible to adjust the scheduler per disk unit. For example, by including this in /etc/rc.local.
# Use NOOP Scheduler
echo "noop" > /sys/block/sdb/queue/scheduler
echo "noop" > /sys/block/sdc/queue/scheduler
Use separate disk for database and transaction loggin
Use a separate “virtual” disk for the database and a separate one for transaction logging if you are using a database on a server. This prevents the filling of the disk, for example, the log disk that the database disk also fills up and possible corruption. Another advantage with this is that you can use separate performance optimisation per disk. So you can set the database disk for example to perform better at reads and the transaction log disk better for writes. This is also valid for separating virtual disk over different datastores in a virtual environment.
Monitor I/O on disks
In dutch we say “meten is weten” **** which translates to “to measure is to know”. So you need to measure your disk performance to see if your changes have the result you want or not.
atop
A nice CLI tool is atop in Linux_,_ here you can see semi realtime the write, reads, transfer speed, io times and wich proces claims the most disk time/
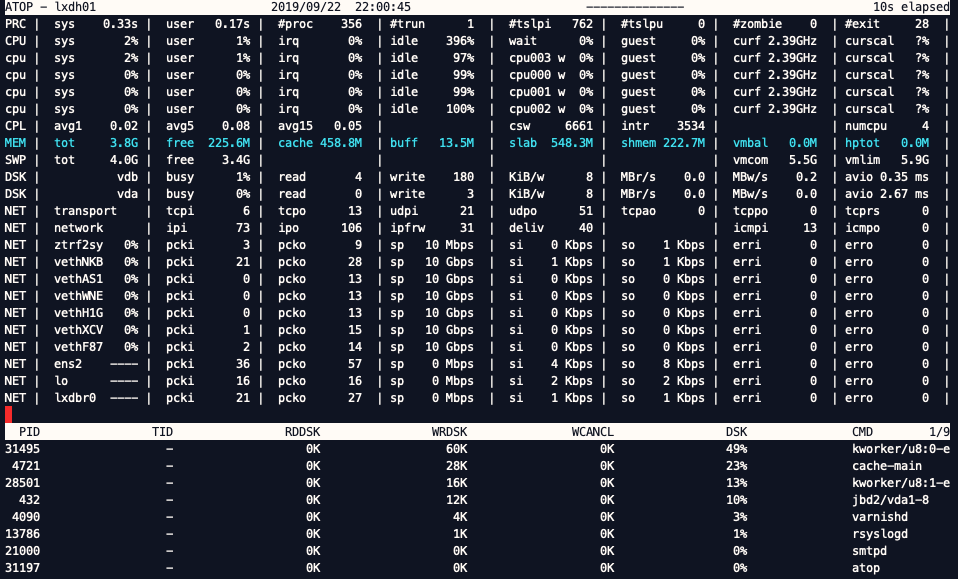
atop
telegraf, influxdb, grafana
For monitoring whole environments, at home or at work. I use many times the TIG stack. Telegraf collects the metrics and stores them into InfluxDB. Grafana create then the graphs in nice dashboard. telegraf can also collects various disk performance metrics.
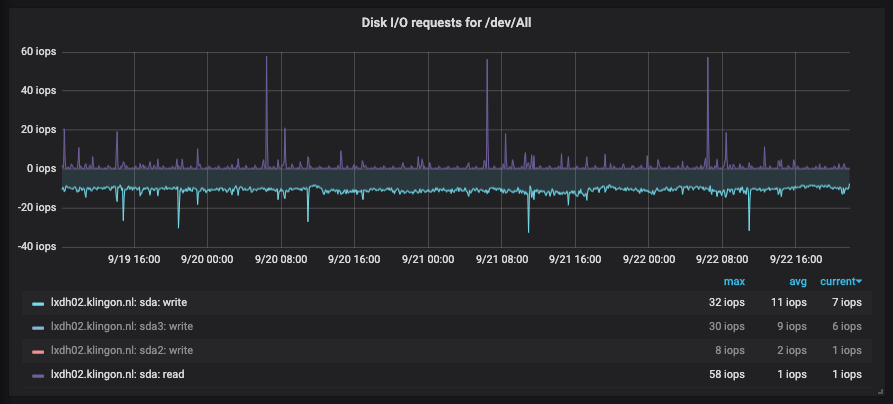
Grafana
observium
Observium is a lamp stack tool that monitoring various metrics via SNMP. It also can monitor disk performance.
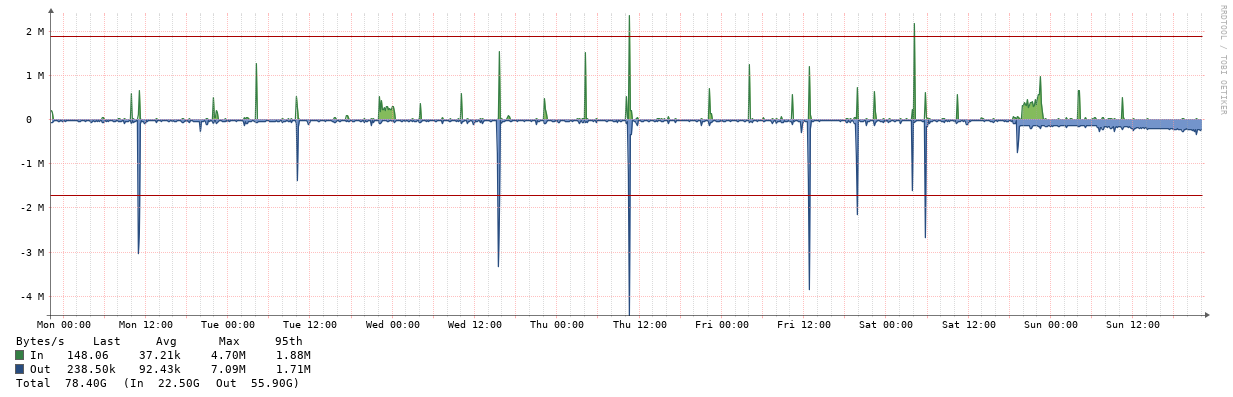
Observium
Disk
To do a syntactic performance test, I used fio on Linux to test read, write and mixed performance.
#Random Read Write
./fio --randrepeat=1 --ioengine=libaio --direct=1 --gtod_reduce=1 --name=test --filename=test --bs=4k --iodepth=64 --size=4G --readwrite=randrw --rwmixread=75

#Random Write
./fio --randrepeat=1 --ioengine=libaio --direct=1 --gtod_reduce=1 --name=test --filename=test --bs=4k --iodepth=64 --size=4G --readwrite=randread

#Random Read
./fio --randrepeat=1 --ioengine=libaio --direct=1 --gtod_reduce=1 --name=test --filename=test --bs=4k --iodepth=64 --size=4G --readwrite=randwrite